

User Rating: 5 / 5

These flow charts were employed by the gold & oil trader, Reza Zarrab, to explain the complex movement of funds in his massive, billion dollar Iran oil sanctions evasion case, where he testified against his former Halkbank banker. We do not ordinarily display trial exhibits, but in light of reader interest in the proceedings, we feel it will help unravel the complex money laundering scheme.
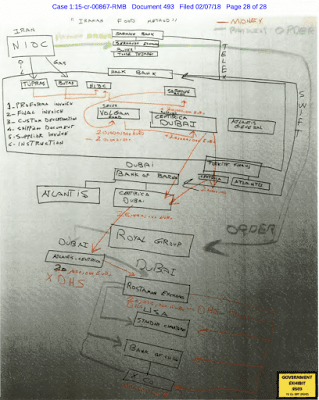
SECOND FLOW CHART OF MOVEMENT OF STOLEN MONEY
You may wish to review the 28-page Order and Decision in the case, to further understand how money was moved from Turkey to Iran. It is in the previous blog article.
Chronicles of Monte Friesner - Financial Crime Analyst
Contributed by Kenneth Rijock - Financial Crime Consultant


